I frequently get asked about utilizing AWS CloudWatch metrics collecting abilities to autoscale DC/OS EE clusters. Usually people figure out quickly how to use the AWS built in metrics (for example CPU utilization) but are not completely sure how they can start emitting their own, custom ones and use those instead.
In this article, I will help you set up a simple Marathon app that will do just that for us: forward some DC/OS built-in metrics and even create and push a custom one.
Prerequisites
- DC/OS Enterprise Edition version 1.11.x or later
- Machine with DC/OS CLI installed and configured
- Access to AWS CloudWatch console and enough permissions to view and interact with the metrics.
Let’s start with creating a service account that will be used to interact with the AWS CLI.
SERVICE_PRINCIPAL="reporter"
dcos package install --cli dcos-enterprise-cli --yes
curl -k -v $(dcos config show core.dcos_url)/ca/dcos-ca.crt -o dcos-ca.crt
dcos security org service-accounts keypair ${SERVICE_PRINCIPAL}-priv.pem ${SERVICE_PRINCIPAL}-pub.pem
chmod 400 ${SERVICE_PRINCIPAL}-pub.pem
dcos security org service-accounts create -p ${SERVICE_PRINCIPAL}-pub.pem -d "DCOS service account for external integration" ${SERVICE_PRINCIPAL}
dcos security org service-accounts show ${SERVICE_PRINCIPAL}
dcos security secrets create-sa-secret ${SERVICE_PRINCIPAL}-priv.pem ${SERVICE_PRINCIPAL} pk_${SERVICE_PRINCIPAL}
dcos security org users grant ${SERVICE_PRINCIPAL} dcos:adminrouter:ops:mesos full
dcos security org users grant ${SERVICE_PRINCIPAL} dcos:adminrouter:ops:slave full
dcos security org users grant ${SERVICE_PRINCIPAL} dcos:adminrouter:ops:system-metrics full
Add your AWS credentials as secrets in DC/OS
dcos security secrets create -v <Key ID> AWS_ACCESS_KEY_ID
dcos security secrets create -v <Secret> AWS_SECRET_ACCESS_KEY
dcos security secrets create -v <Region> AWS_DEFAULT_REGION
You can now run the following Marathon app that will start reporting to AWS CloudWatch:
echo '{
  "id": "/monitoring/awsrep",
  "backoffFactor": 1.15,
  "backoffSeconds": 1,
  "container": {
    "type": "DOCKER",
    "volumes": [],
    "docker": {
      "image": "dobriak/aws-rep:0.0.4",
      "forcePullImage": false,
      "privileged": false,
      "parameters": []
    }
  },
  "cpus": 0.4,
  "disk": 0,
  "env": {
    "SA_SECRET": {
      "secret": "secret0"
    },
    "AWS_ACCESS_KEY_ID": {
      "secret": "secret1"
    },
    "AWS_DEFAULT_REGION": {
      "secret": "secret2"
    },
    "AWS_SECRET_ACCESS_KEY": {
      "secret": "secret3"
    },
    "SA_NAME": "reporter"
  },
  "instances": 1,
  "maxLaunchDelaySeconds": 3600,
  "mem": 128,
  "gpus": 0,
  "networks": [
    {
      "mode": "host"
    }
  ],
  "portDefinitions": [],
  "requirePorts": false,
  "secrets": {
    "secret0": {
      "source": "pk_reporter"
    },
    "secret1": {
      "source": "AWS_ACCESS_KEY_ID"
    },
    "secret2": {
      "source": "AWS_DEFAULT_REGION"
    },
    "secret3": {
      "source": "AWS_SECRET_ACCESS_KEY"
    }
  },
  "upgradeStrategy": {
    "maximumOverCapacity": 1,
    "minimumHealthCapacity": 1
  },
  "killSelection": "YOUNGEST_FIRST",
  "unreachableStrategy": {
    "inactiveAfterSeconds": 0,
    "expungeAfterSeconds": 0
  },
  "healthChecks": [],
  "fetch": [],
  "constraints": []
}' > awsrep.json

dcos marathon app add awsrep.json
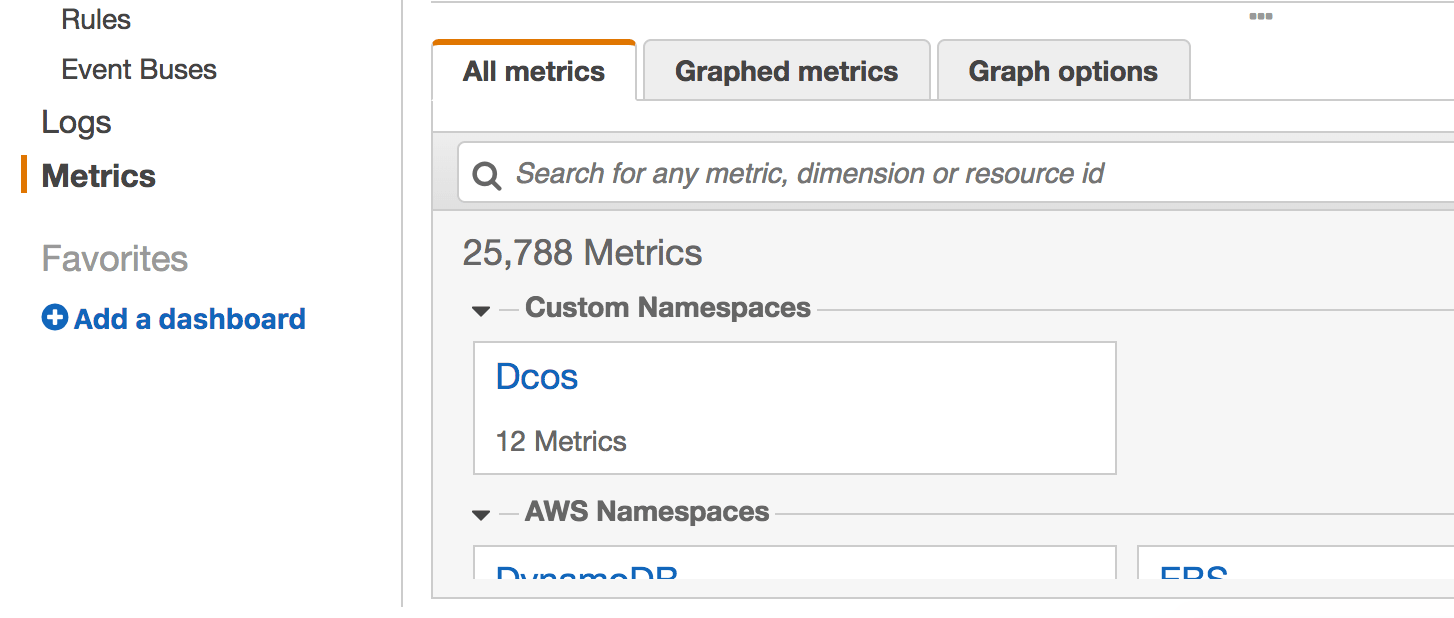
If everything works as expected, you should be able to find the custom metrics in AWS CloudWatch, under the Dcos namespace:

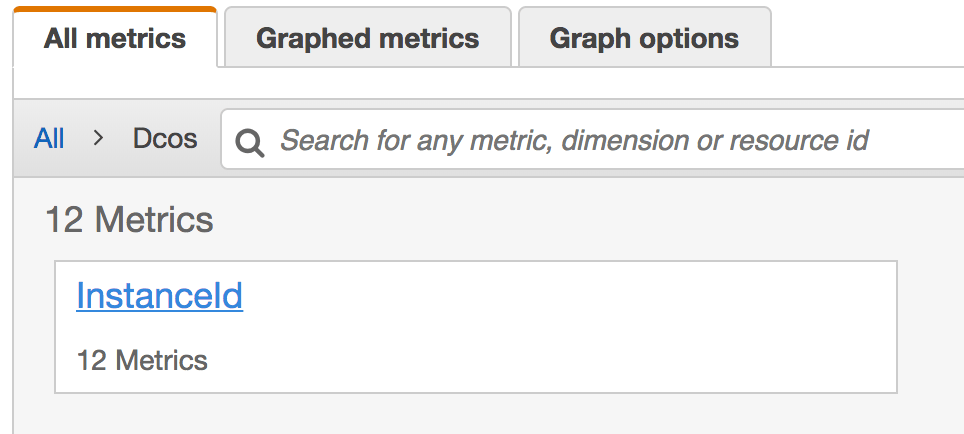
Under the Dcos namespace you will find our only dimension - InstanceId:

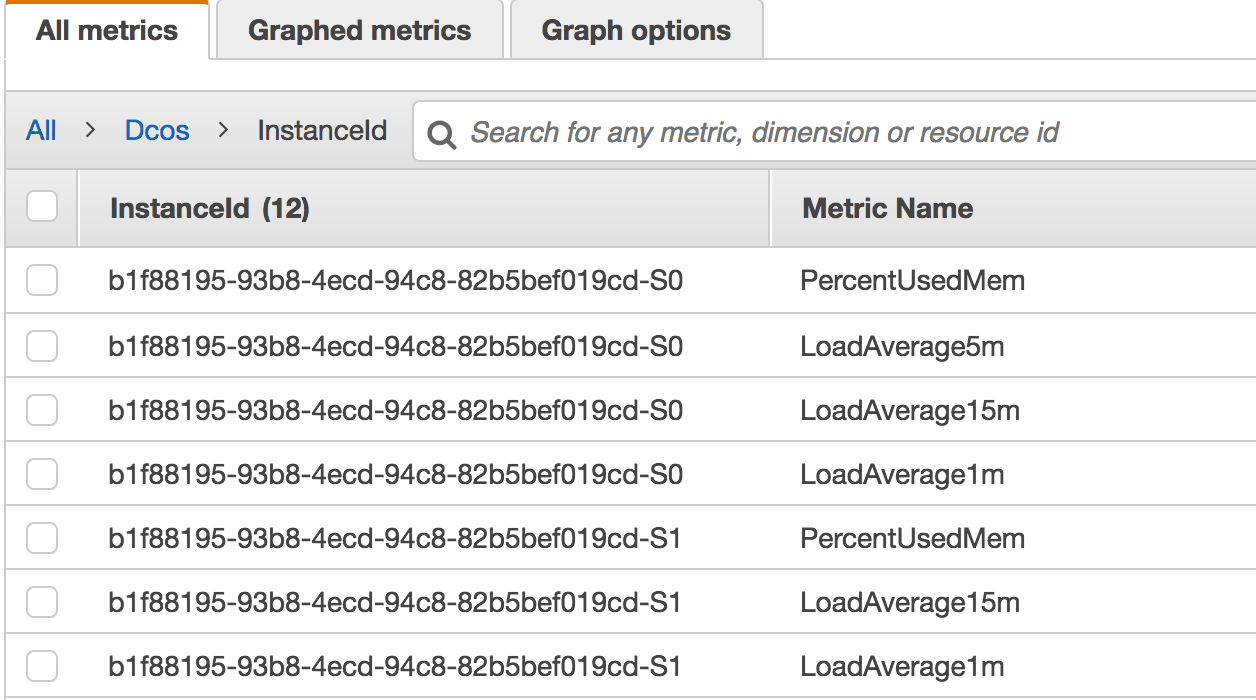
Each instance will have 4 metrics that can be used to set up alarms for your auto scaling group(s):

On hints how to use the above metrics and for all source code, please visit my repository.